Geolet
A lightweight Python library for drawing geometry problems using Asymptote.
Why Geolet?
Creating geometry diagrams for math handouts is painful:
- GeoGebra requires manual export and fiddly positioning
- Raw Asymptote code is verbose and low-level
- TikZ/PGF has a steep learning curve
Geolet provides a high-level, Pythonic API that generates clean Asymptote code underneath.
Quick Example
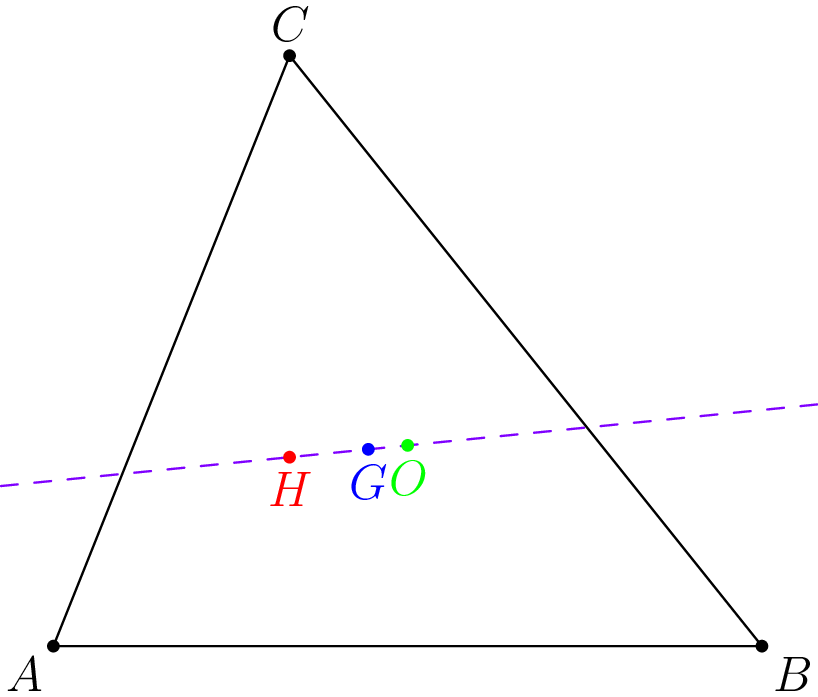
from geolet import Line, Point, Triangle, autofigure


@autofigure
def euler_line():
    A = Point("A", 0, 0, label_dir="SW")
    B = Point("B", 6, 0, label_dir="SE")
    C = Point("C", 2, 5, label_dir="N")

    T = Triangle(A, B, C)

    H = T.orthocenter(label="H", label_dir="S", color="red")
    G = T.centroid(label="G", label_dir="S", color="blue")
    O = T.circumcenter(label="O", label_dir="S", color="green")

    Line(H, O, color="purple", style="dashed")
Generate output with the CLI:
Features
- Intuitive API: Create points, lines, circles, and triangles with simple function calls
- Triangle Centers: Built-in support for orthocenter, centroid, circumcenter, incenter
- Geometric Operations: Intersections, reflections, inversions, tangent lines
- Automatic Layout: Smart label positioning with compass directions (N, NE, E, ...)
- Multiple Outputs: Generate Asymptote source, PDF, or SVG
Installation
Asymptote must be installed separately: